It was only in 2011, with T20 cricket gaining popularity, that the number of runs per over rose above five runs and it spiked further to 5.65 in the previous edition.
Shared News| Updated: June 1, 2019 10:32:03 am
Chris Gayle scored a double century in the previous edition of ICC World Cup, held in Australia. (AP Photo)
Back in the early 1970s and 80s, a score around 200 was considered a competitive total, which was often enough to add a sustainable amount of pressure on the side batting second. But from the inaugural edition back in 1975 to the previous one held four years ago, the tournament has witnessed an exponential rise in the total runs being scored in every edition.
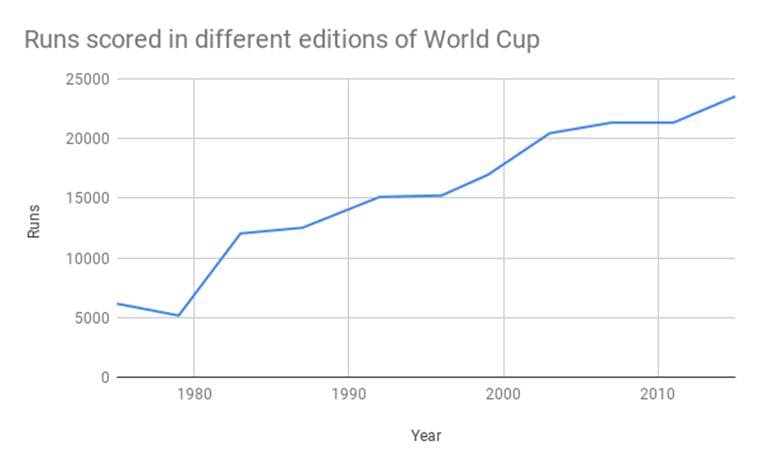
Runs scored in different editions of World Cup

Unlike the current 50-over format, the inaugural edition of the event kicked-off with 60 overs in each inning. In the first edition, a total of 6162 runs were scored in 15 matches. However, there was a massive dip in the next edition, with only 5168 runs being scored in 14 matches. In 1983, there was a significant rise in the number of runs being scored with the number of matches almost doubling from 14 to 27. Over 12,000 runs were scored in this edition.
The 1987 edition of the tournament saw the 50 over format being introduced. But despite the reduction in overs, the fourth edition of the World Cup saw more runs being scored – 12,522 runs – on the flatter tracks of India and Pakistan.
In 1992, despite the number of matches being increased from 27 to 39, the number of runs scored was 15107.
The following edition which was played in the sub-continent was another happy outing for batsmen, with the batsmen crossing the 300-run mark in five instances. It also saw the Arjuna Ranatunga-led Sri Lankan unit fall two runs short of becoming the first nation to reach the 400-run-mark in ODIs. In the 1999 edition – played in England – there was a dip in runs scored.
However, with the introduction of T20 cricket, all the World Cups post-2000 has seen over 20,000 runs being scored. The previous edition which was co-hosted by Australia and New Zealand saw another landmark in the contest between the bat and the ball. Martin Guptill and Chris Gayle became the only batsmen to notch-up double centuries in the showpiece event.
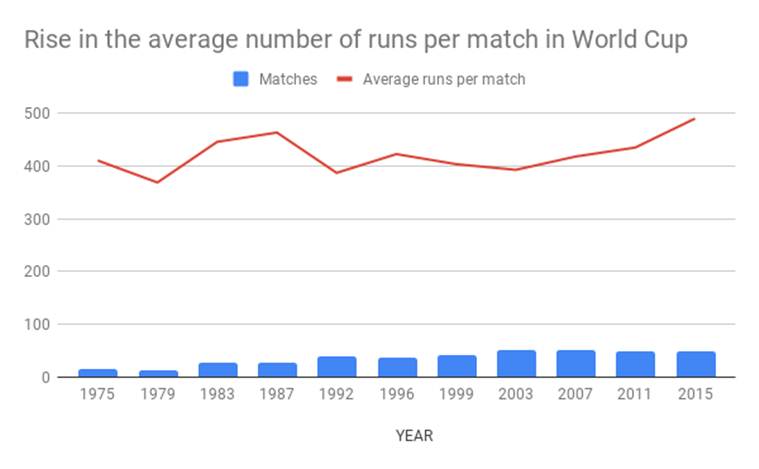
Rise in the average number of runs per match

West Indies may have won the 1975 World Cup, but the batting charts were topped by England. The team posted a mammoth 334/4 in the tournament opener against India, which eventually ended up being the highest team total in the tournament. With a total of 15 games being played, the average run per match in this edition was 410.8. However, in the second edition, the average dropped to 369.14 and none of the teams crossed the 300-run-mark.
In the third edition, the average number of runs in a match was beyond 400 and it settled at 463.7 in the next edition. However, in 1992 the average crashed below 400 per match.
However, since 2007, the average has been on the rise and almost crossed the 500-run-mark in the previous edition. Will it cross the mark in this edition?
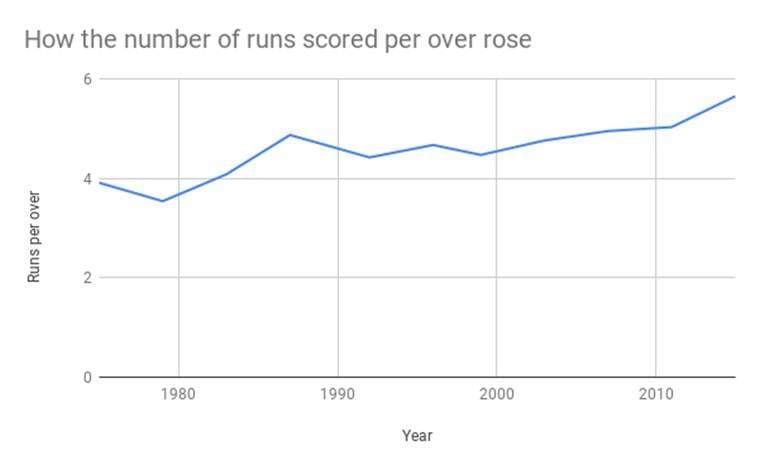
How the number of runs per over rose

Every edition of the World Cup has witnessed a gradual rise in the average number of runs scored per over. In the first two editions, the scoring rate per over remained under four runs. However, for the first time in 1983, the scoring rate jumped over 4 runs. It was only in 2011, with T20 cricket gaining popularity, that the number of runs per over rose above five runs and it spiked further to 5.65 in the previous edition.


